TIMSS case study analysis with the IEA IDB Analyzer
Assessment of the effect of gender, country, school location, and homesocioeconomic status status on mathematical reasoning and life science results. Descriptive statistics and linear regression analyses are utilized in the tutorial.
1 Introduction
This document demonstrates the preparation and analysis of the TIMSS 2023 (Trends in International Mathematics and Science Study 2023) dataset using the IEA IDB Analyzer. TIMSS 2023 is conducted every 4 years and to assess the mathematics and science skills of 4th-graders and 8th-graders.
The analysis presented here focuses on differences in mathematical reasoning (problem-solving, argumentation, mathematical thinking) and life science (biology-related content relating to, e.g., cells, ecosystems, health) by country and gender. The mathematical reasoning is a subdomain of the broader mathematics domain and life science is a subdomain of broader science domain.
Next, linear regression is used to examine:
- the relationship between the size of the school’s locality and mathematical reasoning results;
- the relationship between socioeconomic status (SES) and life science results;
We will focus on 4th-graders from Poland, Germany, Georgia and New Zealand.
More about the IEA IDB Analyzer package can be found in our tutorial.
2 Data download and merging
First we should download the data. The data can be downloaded from www.iea.nl/data-tools/repository/timss.
Depending on the software you want to use to run scripts generated by the IEA IDB Analyzer, you should download the data in the appropriate format (e.g., R or SPSS).
This tutorial uses R, so we will download the data in R format and save it to the desired directory.
The variables we will focus on are:
IDCNTRY- Country nameITSEX- students’ genderASBHSES- home socioeconomic statusACGB05B- size of the village/town/city where the school is locatedASMREA01-ASMREA05- mathematical reasoning scoreASSLIF01-ASSLIF05- life science score
We will use the merge module of the IEA IDB Analyzer to create a dataset with the variables listed above.
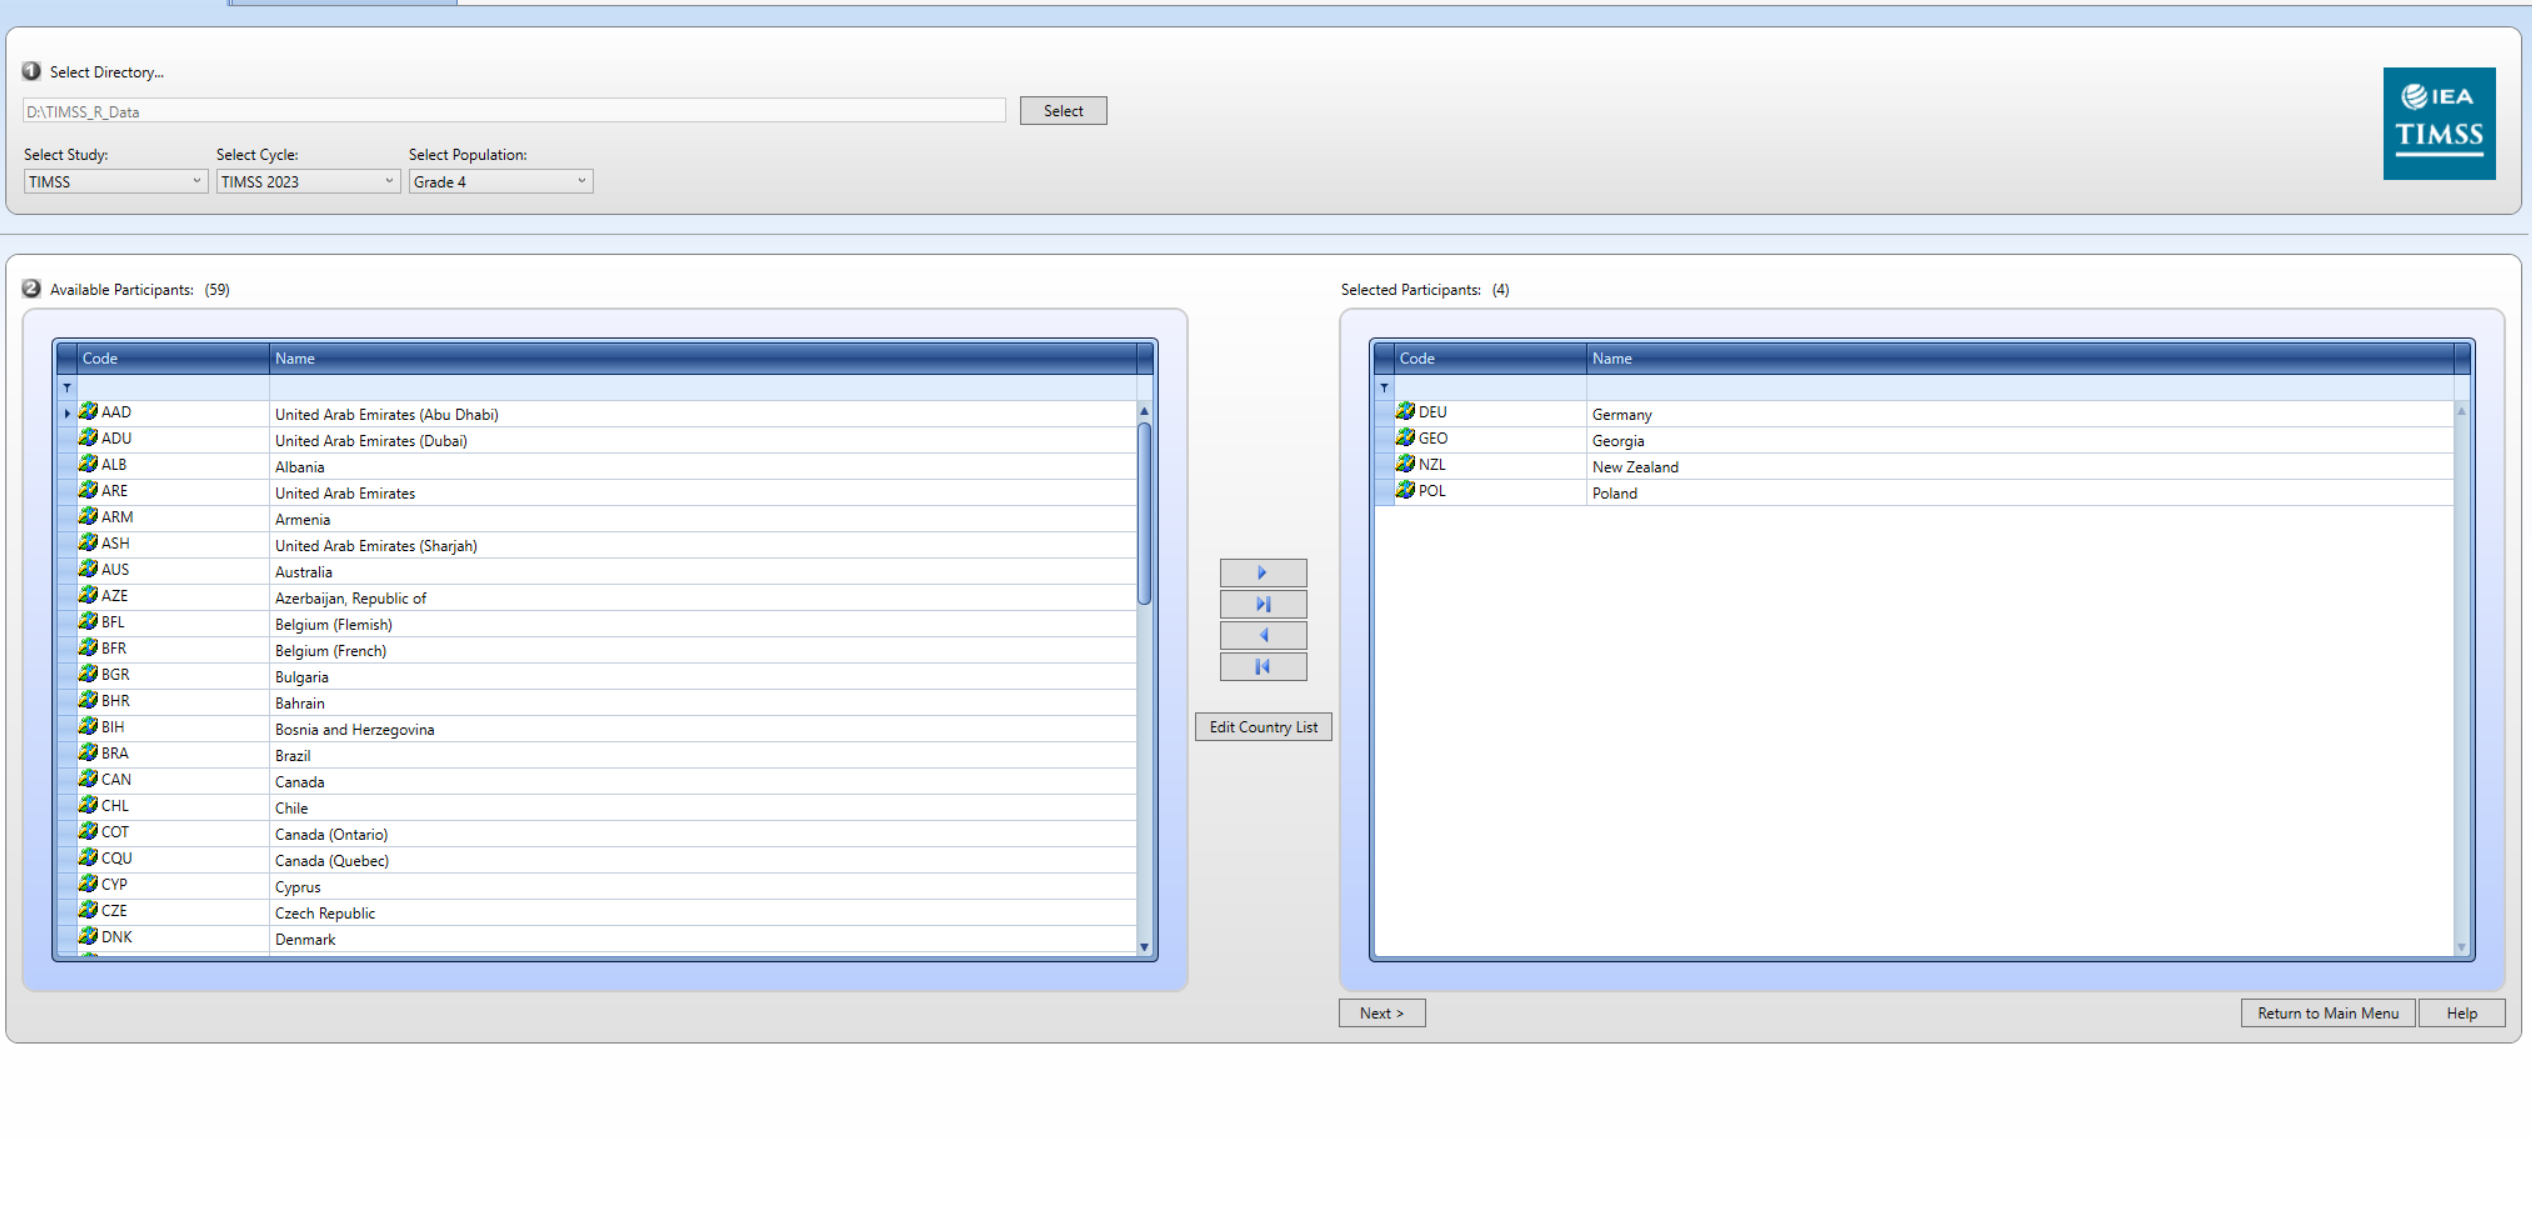
First, we will select the countries of interest (Poland, Germany, Georgia and New Zealand).
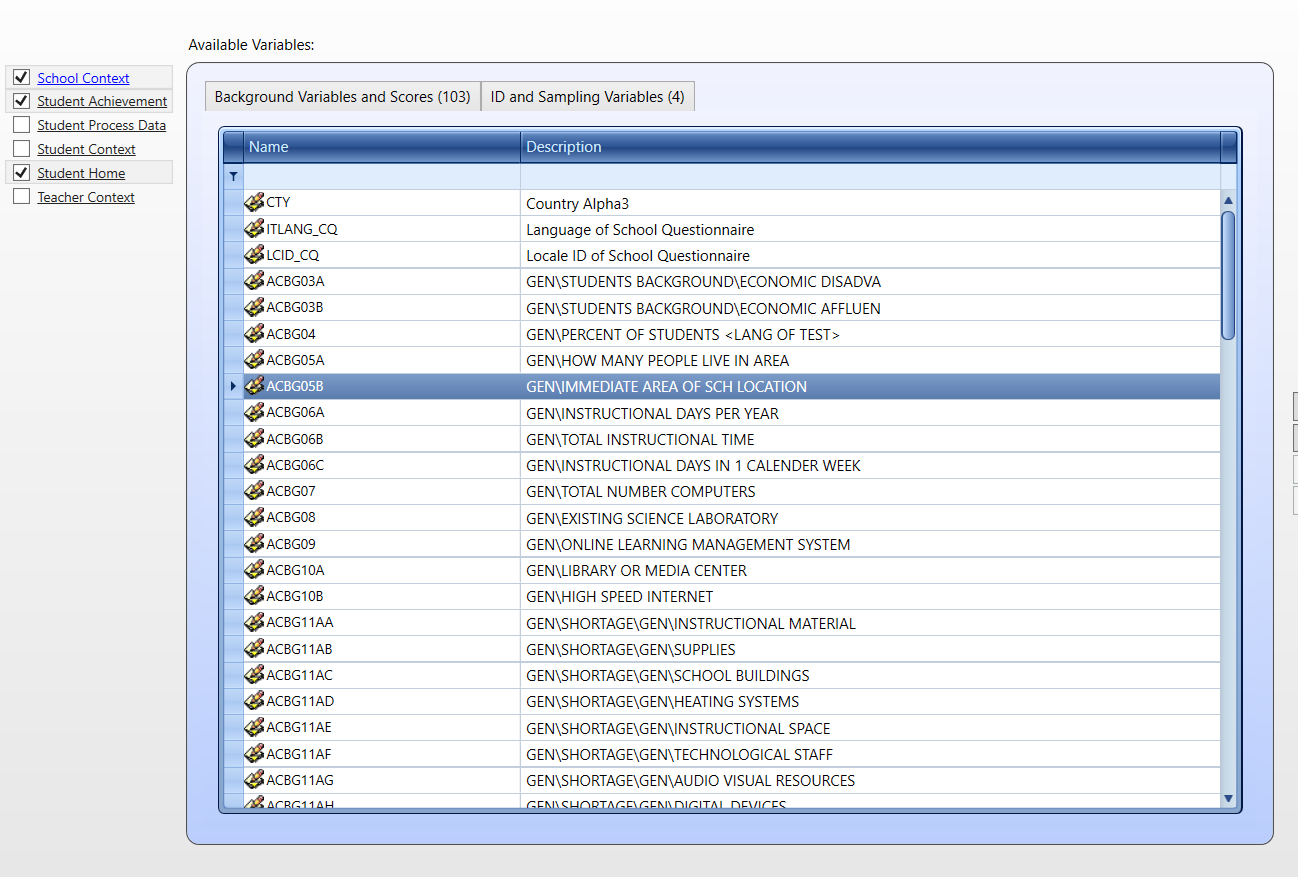
Next, we will select the datasets and variables of interest.
We need to select School Context, Student Achievement and Student Home datasets.
From the School Context dataset we will select the ACGB05B variable (size of the place of school’s locality).
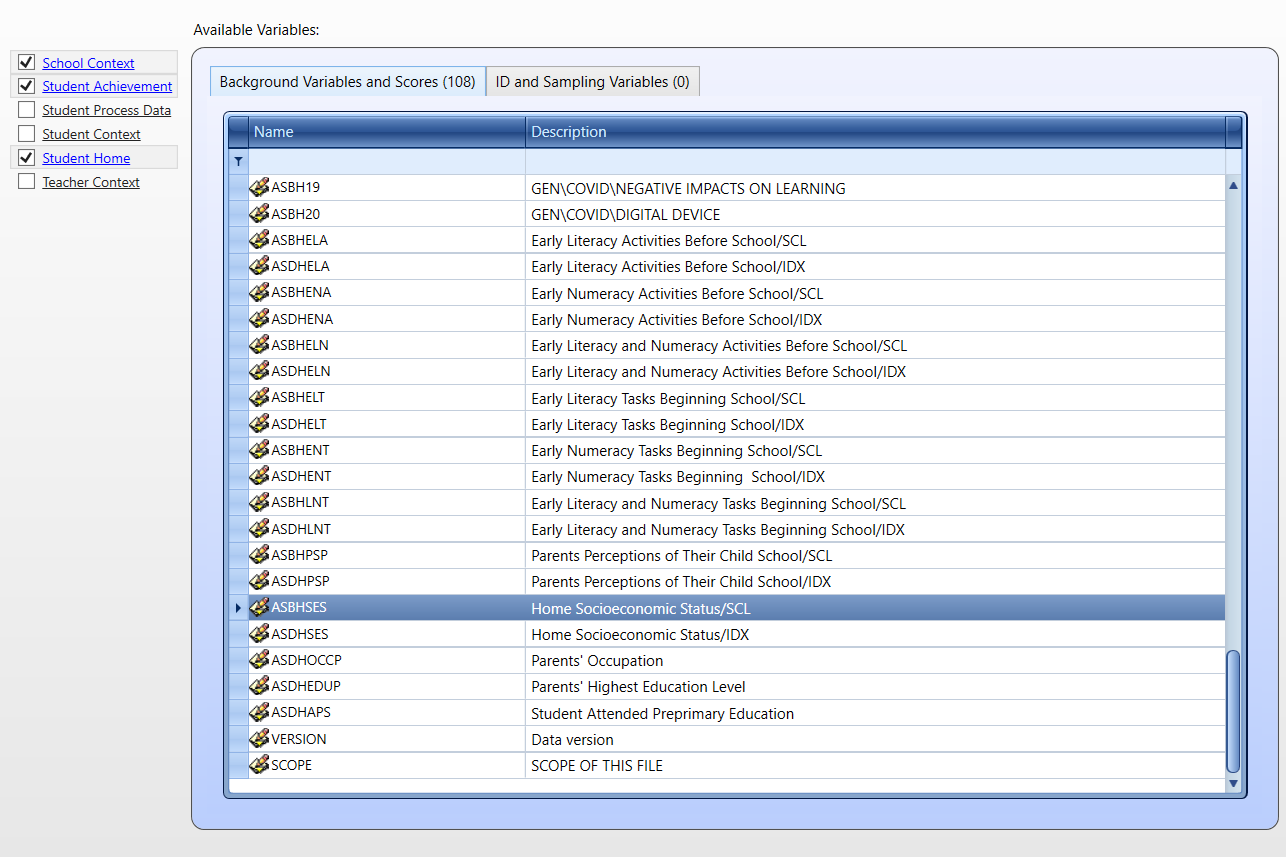
From the Student Home dataset we will select the ASBHSES variable (home socioeconomic status).
Next we need to save the R script and run it in RStudio or any other R IDE.
3 Descriptive statistics
After running the script, we can go back to the main menu of the IEA IDB Analyzer and select the Analysis module.
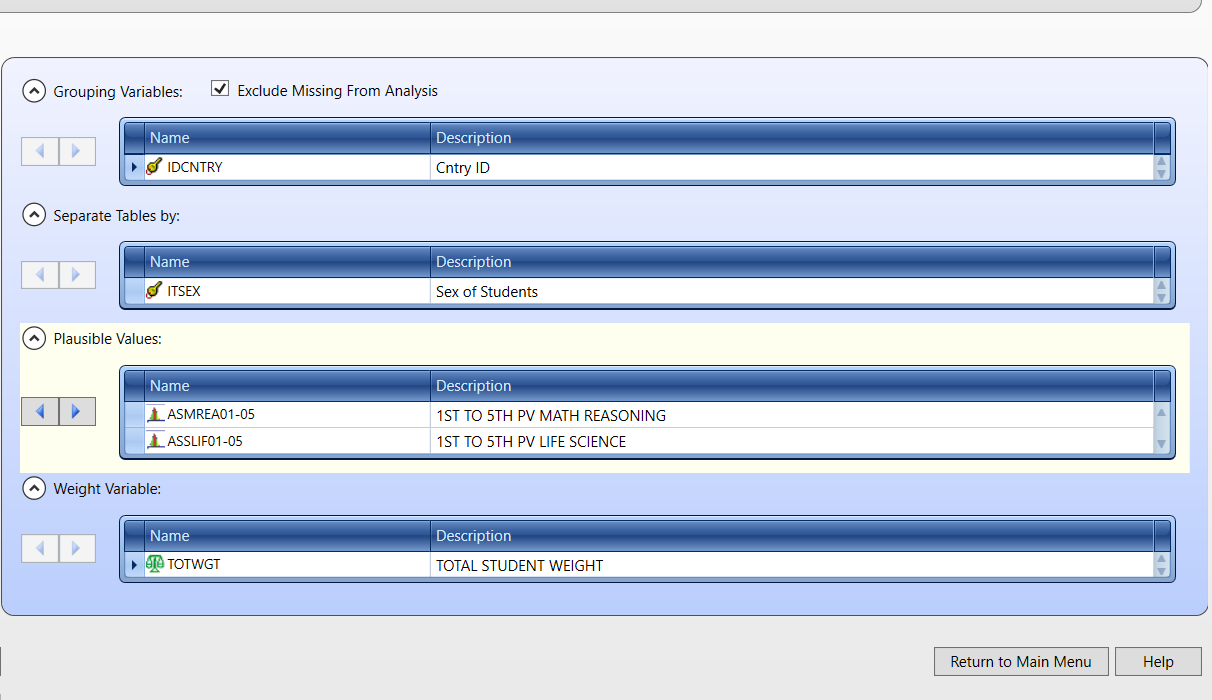
Then we should choose the dataset created in the previous step, select TIMSS (Using Student Weights) as the analysis type and Percentages and Means as the Statistic Type. Other options should be left as default.
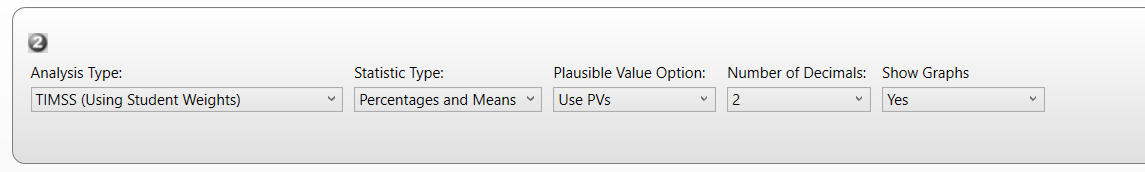
We want to separate tables by gender and use the plausible values of mathematical reasoning and life science scores. The weights are selected by default.
Next, save the R script and run it. Since we want to produce an analysis for two variables we will obtain two reports. Reports in .html should open automatically when R finishes the analysis.
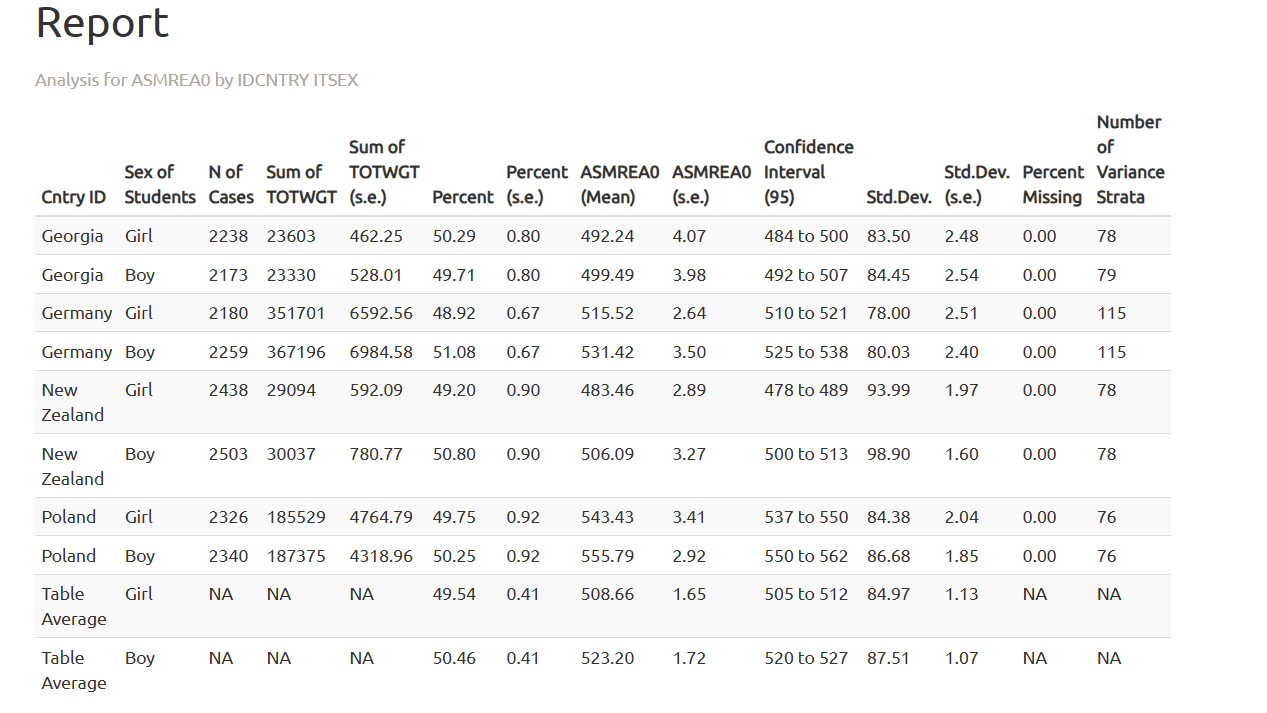
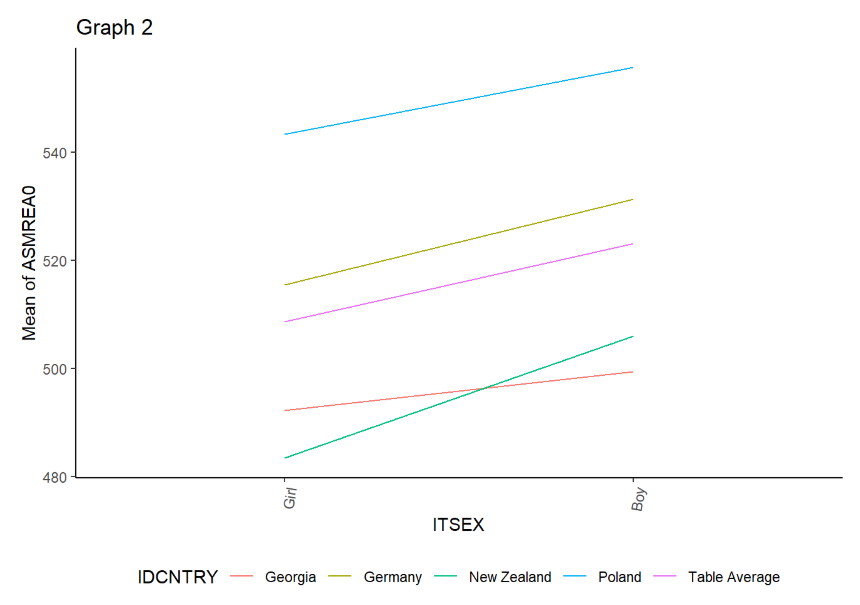
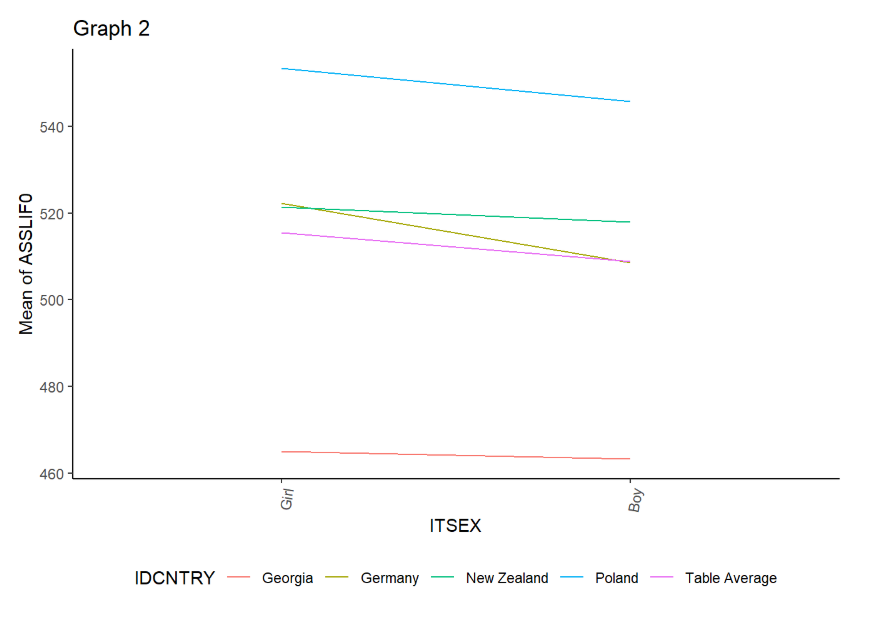
We should scroll down to the Report section of the .html files to see the results. First let’s look at the results for mathematical reasoning.
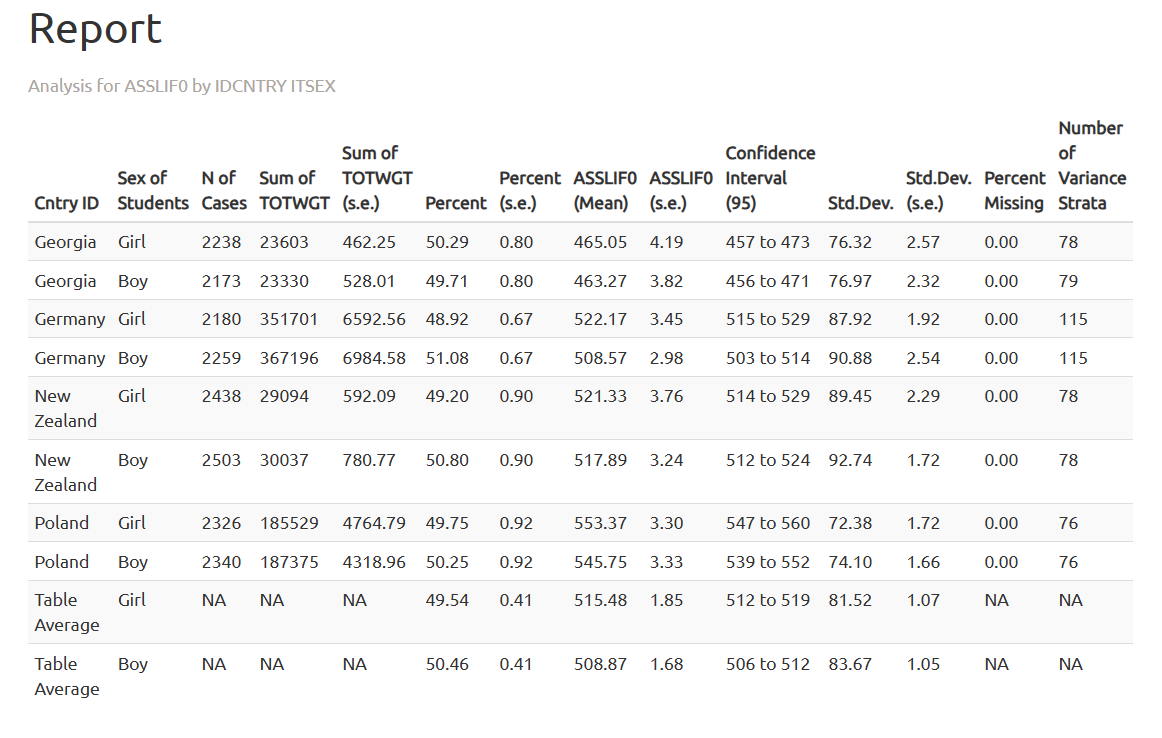
Next, we will explore the results for life science.
4 Size of the school’s locality and mathematical reasoning results
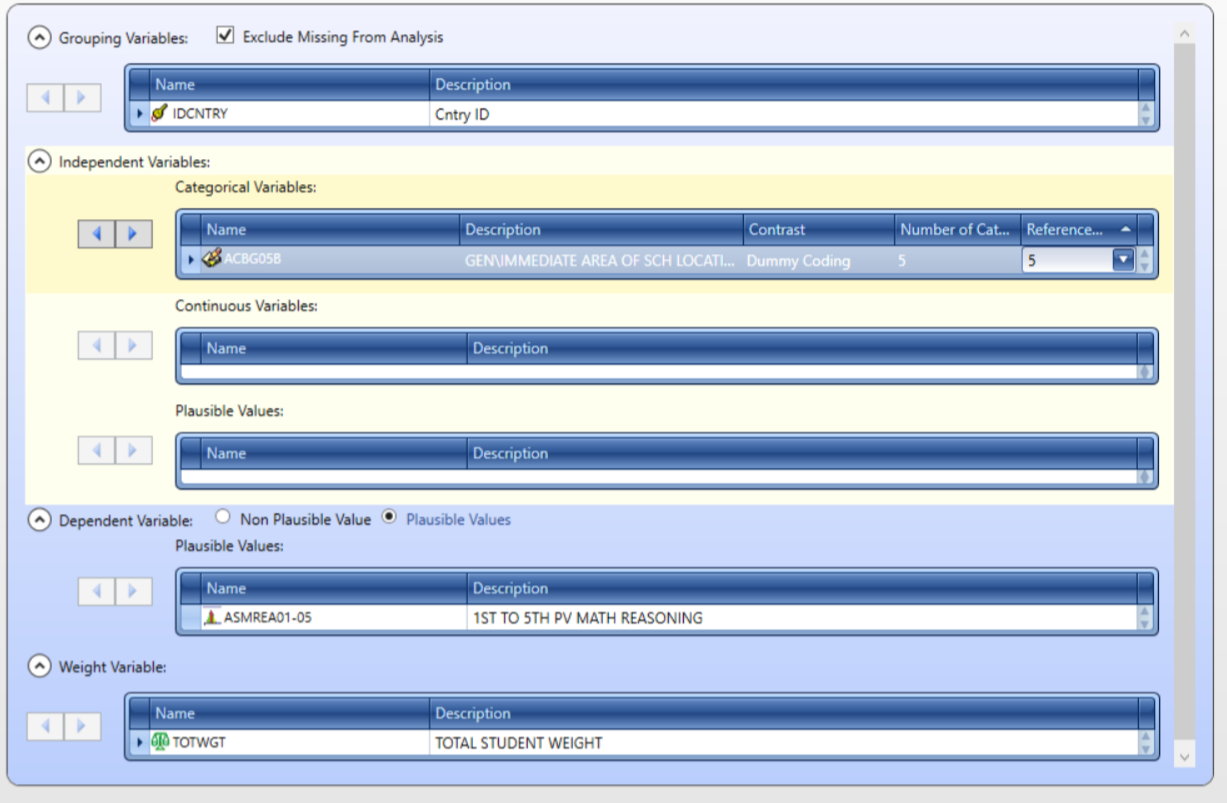
Now, we will go back to the analysis module of the IEA IDB Analyzer and select TIMSS (Using Student Weights) as the analysis type and Linear Regression as the Statistic Type.
We will select mathematical reasoning plausible values as the dependent variable and size of the school’s locality (ACGB05B) as the independent variable.
This is a categorical variable with 5 levels:
1- Urban–Densely populated2- Suburban–On fringe or outskirts of urban area3- Medium size city or large town4- Small town or village5- Remote rural
We have to change the number of categories to 5 and select 5 as the reference category.
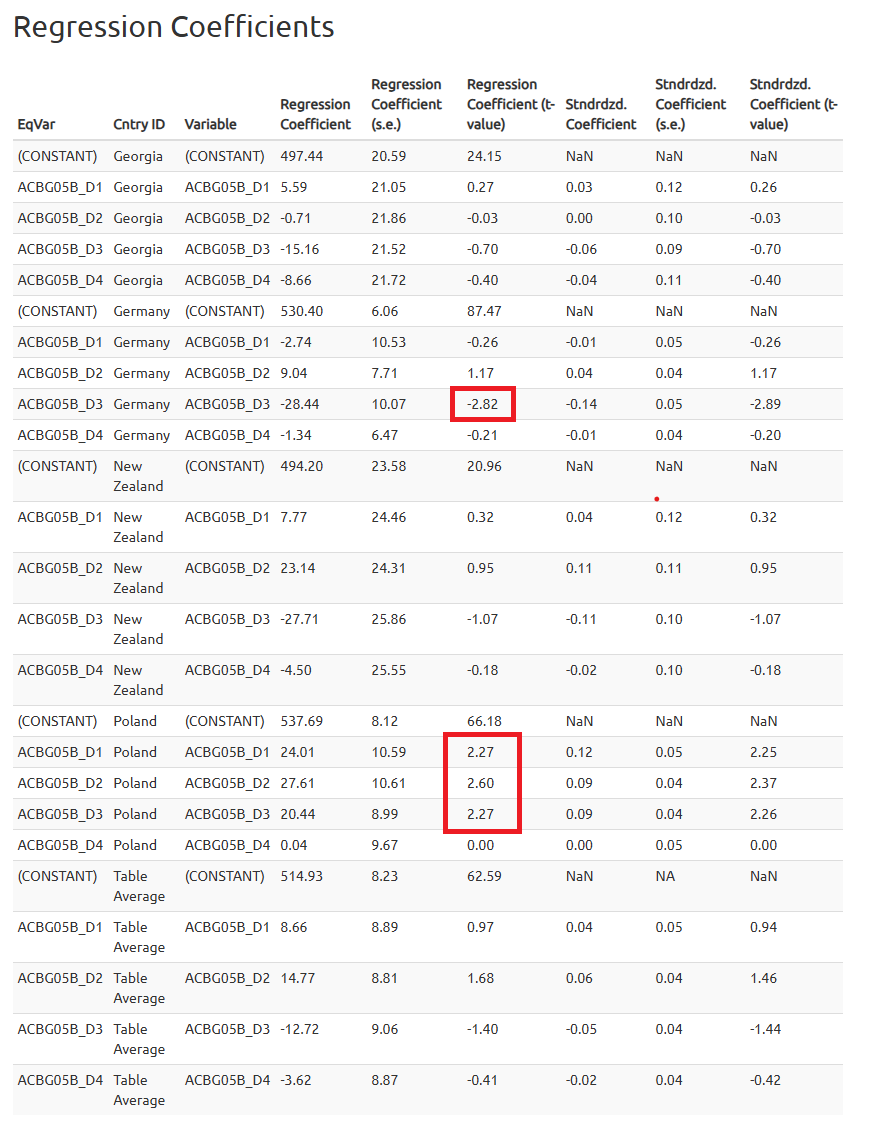
As previously, we will save the R script, run it and explore the results in the Report section of the .html file.
To determine if the predictor is significant, we should look at the t-values in the regression output.
A t value greater than 1.96 (in absolute value) indicates that the predictor is statistically significant at the 0.05 significance level.
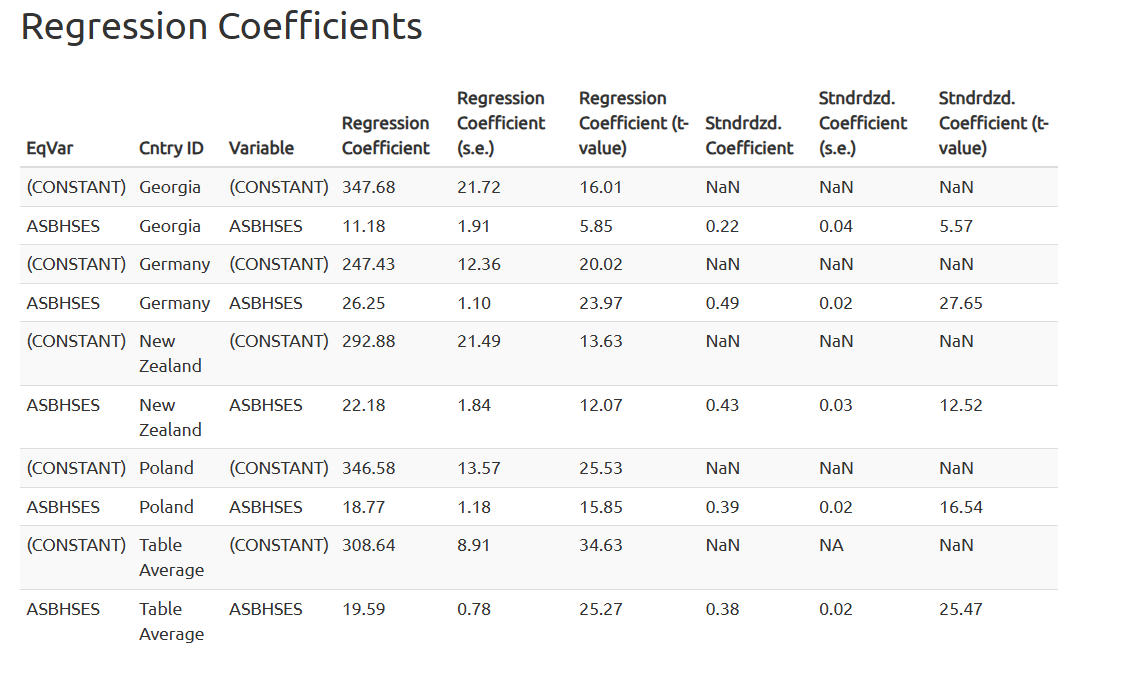
5 Socioeconomic status and life science results
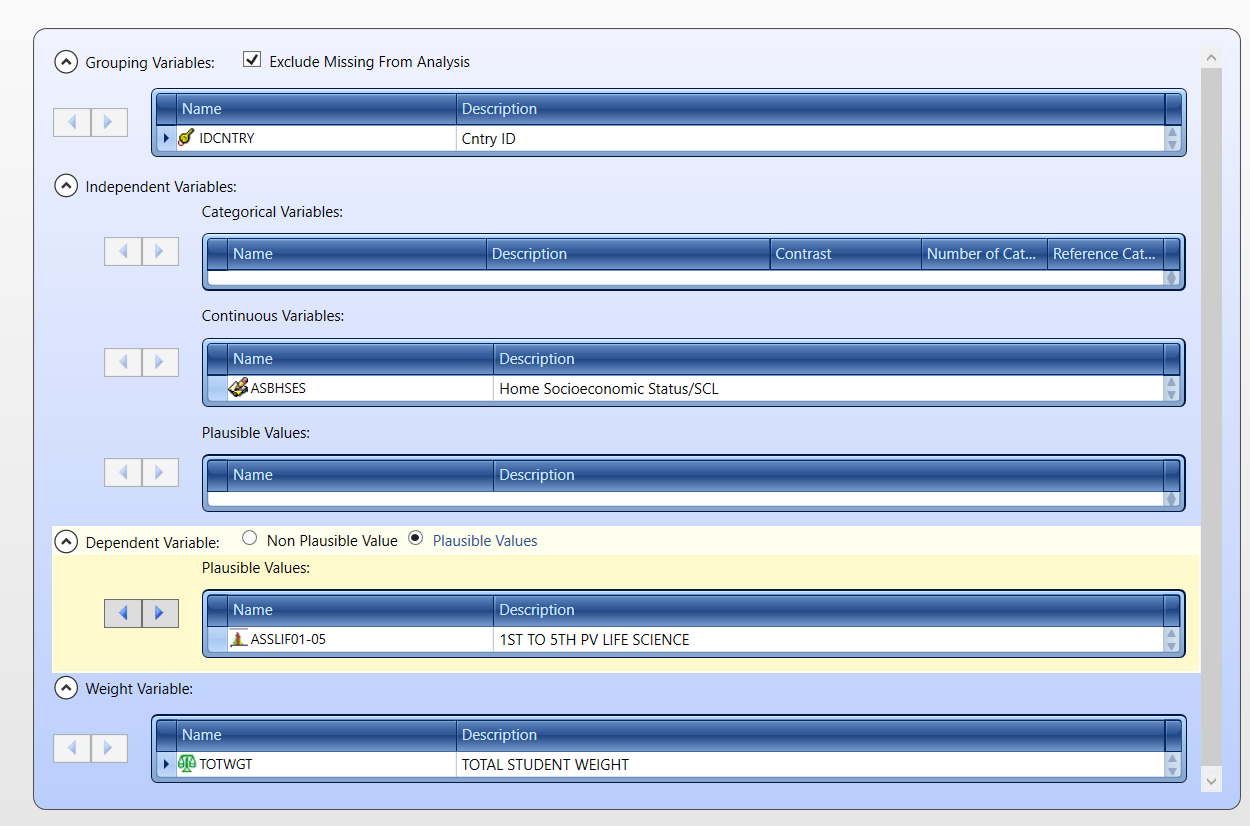
Finally, we will explore the relationship between socioeconomic status (SES) and life science results.
The definition of the analysis is similar to the previous one. The SES should be used as a continuous predictor.
There are two variables related to home socioeconomic status:
- ASBHSES - Home Socioeconomic Status/SCL (continuous variable); - ASDHSES - Home Socioeconomic Status/IDX (categorical variable);
For the regression analysis, we will use the continuous variable (ASBHSES). However, the categorical variable (ASDHSES) can be used in this analysis as well similar to the regression analysis with school location as a predictor.
6 Summary
This document demonstrates how to prepare and analyze the TIMSS 2023 dataset using IEA IDB Analyzer. We covered data merging using the IEA IDB Analyzer, conducting descriptive statistics and regression analyses while accounting for the complex survey design. The results provide insights into differences in mathematical reasoning and life science results by country, gender, size of the school’s locality, and socioeconomic status.